Code Coverage Cannot See a Cookie Banner. Screenshot Coverage Can.


There is a prompt every team gives a coding agent sooner or later: write tests until you reach 100% line coverage.
The agent gets there. Every component runs under a test, the report is green, and the agent declares the goal achieved. A week later someone breaks the styles on the cart button. Coverage is still 100%. The visual diff is still green. Nobody notices until a customer does.
The agent did not cheat. It optimized the number it was given, and line coverage measures whether code ran, not whether anyone looked at what it drew.
Released September 13, shaka-perf 0.3.0 gives the agent a different number to chase. Here is what that number measures, because the mechanism is the whole point.
Take a store page
Take a store page: a nav bar with a logo, a header, a product grid, a cart button, a footer. Ask an agent for 100% line coverage and it will write tests that render all of it. Every line executes.
Now look at what the screenshots those tests took actually contain. The nav bar and the header are there. The product grid is half there: a cookie banner covers part of it and the rest is below the fold. The cart button is entirely under the cookie banner. The footer never made it into the viewport at all.
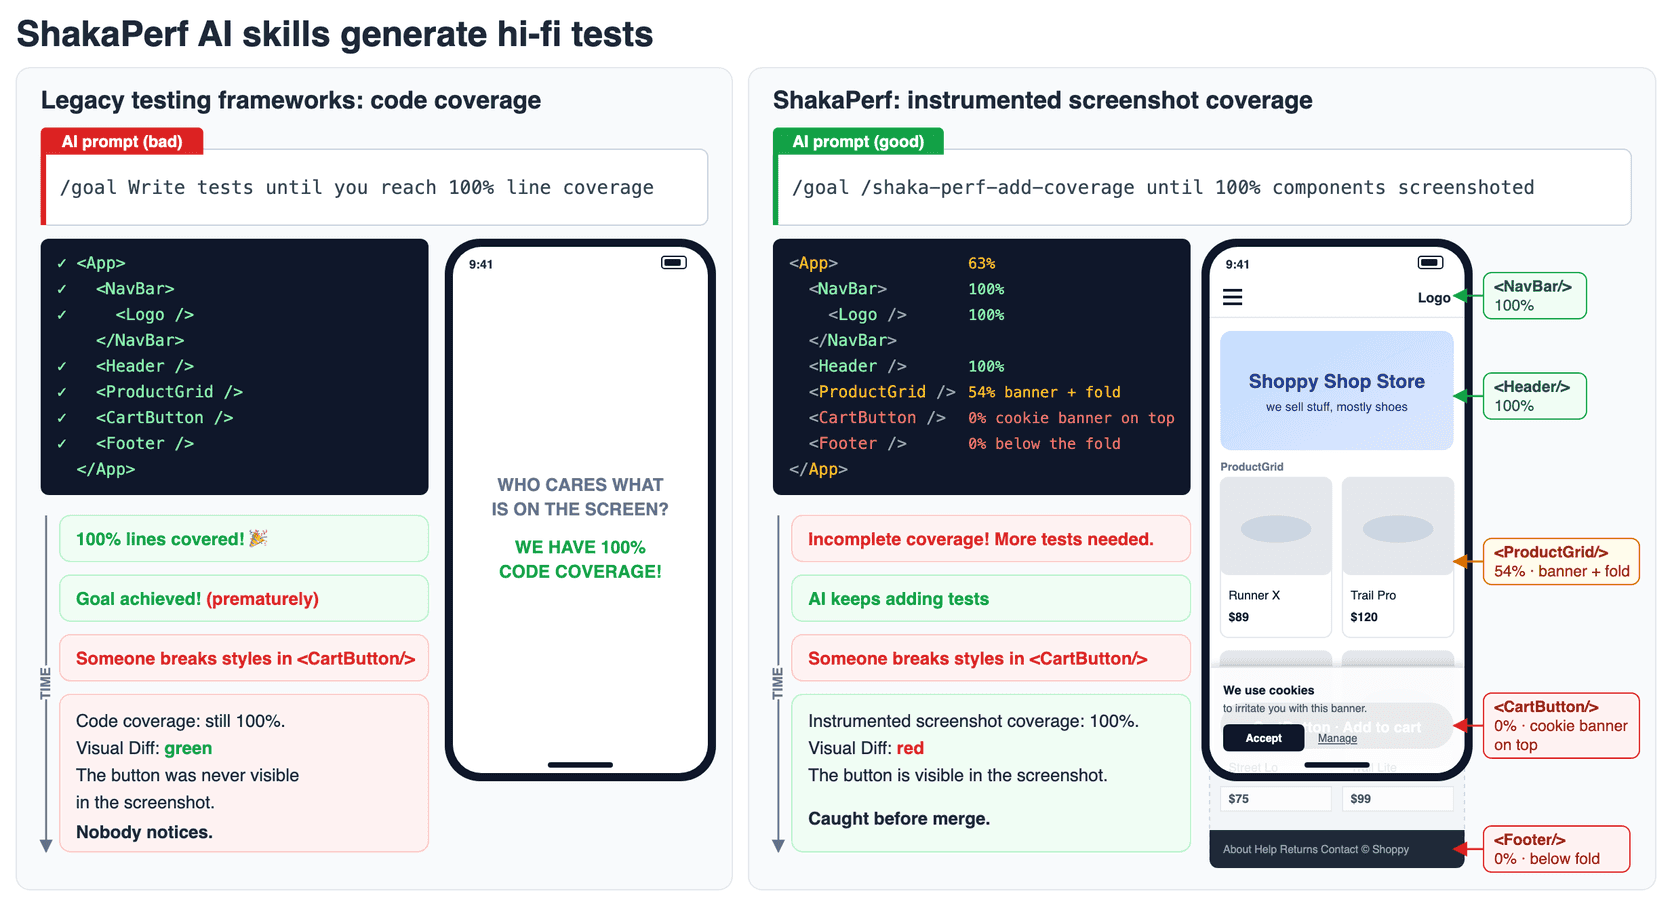
Left: every line ran and the cart button sat under a cookie banner. Right: each component scored by what a screenshot actually showed.
Instrumented screenshot coverage scores each component by how much of it a screenshot showed: nav bar 100%, header 100%, product grid 54%, cart button 0%, footer 0%. That is a failing grade, and the right one, because a test that never sees the cart button cannot tell you when the cart button breaks.
So the prompt changes from a line-count goal to a screenshot goal:
/goal /shaka-perf-add-coverage until 100% components screenshoted/goal is the standing-objective mode in Claude Code (Codex has the same command): the agent keeps working across turns until the stated condition is met. With this goal it dismisses the banner inside the test, captures the sections below the fold at a taller viewport, and keeps going until every component is in the picture. When someone breaks the cart button afterwards, the visual diff turns red before the merge.
What the agent is actually doing
I do not want to sell any of this as "point your agent at the repo". The skills are opinionated, and the diagrams exist so that a human can see what the agent is doing and why.
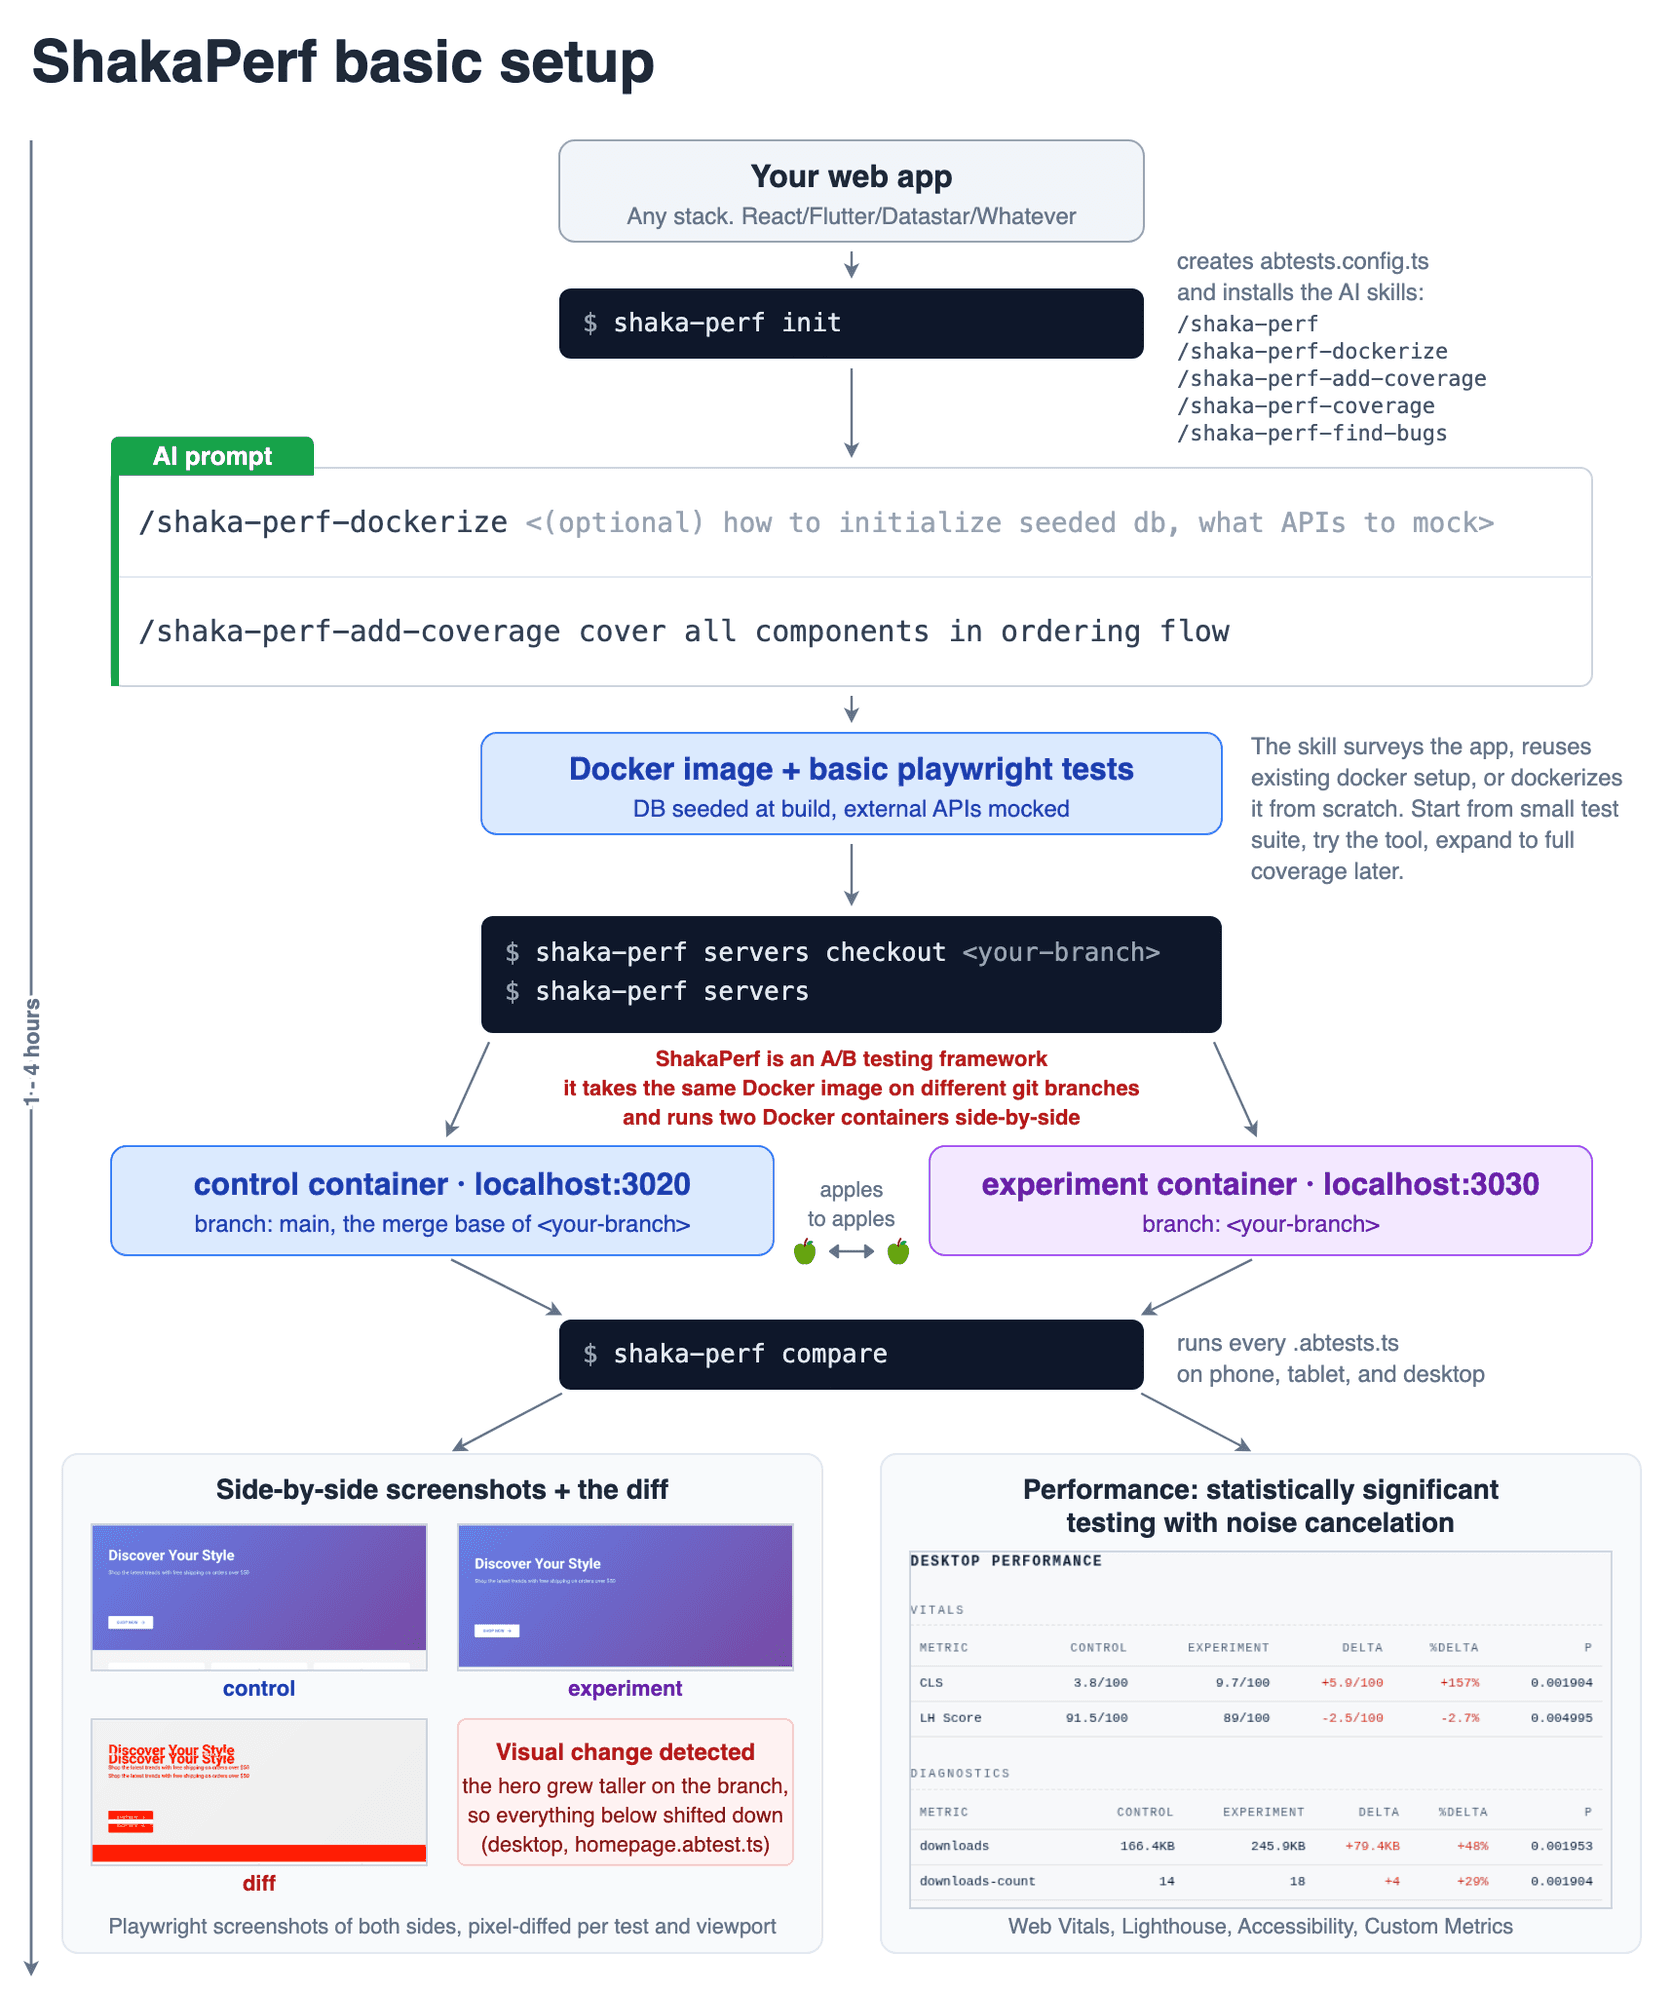
One to four hours from shaka-perf init to the first side-by-side report.
shaka-perf init writes abtests.config.ts and installs five Claude Code skills: the command map, dockerize, add-coverage, coverage, and find-bugs. /shaka-perf-dockerize reuses an existing Docker setup or writes one, with the database seeded at build time and external APIs mocked, and /shaka-perf-add-coverage cover all components in ordering flow gives you the first small test suite. From there it is shaka-perf servers checkout <your-branch>, shaka-perf servers, and shaka-perf compare: every test on phone, tablet and desktop against both sides, with side-by-side screenshots, the pixel diff, and a performance comparison sampled at the same instant on both sides, so machine noise cancels inside each pair. The usage section of the README is the place to start.
What is being measured
The measurement joins two things a test run already produces. The code_coverage audit category writes, per test and viewport, which statements ran and a visibility map: how much of each rendered element fell inside the test's capture region, plus the source line that rendered it. Each line of a component file then carries both: which tests ran it, and what a screenshot showed of what it drew.
return (                                          // A+B   |
  <nav className="site-nav" data-cy="main-nav">   //       | A=100%,B=0%
    <div className="slide">                       //       | A=33%:clipped-by-ancestor,B=0%
    <button onClick={openCart}>Cart</button>      // 0     |
Test A executed the nav and showed all of it. Test B executed the same code and showed none of it. The carousel slide is a third visible in A because the track clips it. The cart button never ran at all. Below 100%, the reason rides along: not rendered, hidden by CSS, clipped by an ancestor, outside the capture region, or obscured by something painted on top, which is where cookie banners, modals and sticky bars live.
The signature this exists to catch is a file with high statement coverage and no element line above 0%. The component runs and paints nothing a test can see. Until now, that file looked fully tested.
The loop the agent runs
The shaka-perf-add-coverage skill is deliberately reluctant to add tests. It finds the tests that already touch the component, saves a baseline, and reads the screenshot cell. If the element ran but was not visible, the fix is usually in an existing test: dismiss the overlay, drive the page to the state that renders the element, use a taller viewport instead of scrolling. Dead code gets a blunt rule: do not edit production files to make it render. Only when those fixes are not enough does it write a new test, and every test follows the house rules for A/B tests: fail loudly, no try/catch, no loops, no if-branches on page state, wait for conditions rather than the clock.
Then it runs the touched tests three times in a row. Flakiness from the tests gets fixed. Flakiness from the page or the server is reported as an application bug, with the failing command, not patched over. An adversarial subagent re-checks the work, the coverage is re-audited and diffed against the baseline, and the loop restarts until every component is covered by tests that do not flake.
What that costs
Screenshot coverage needs an instrumented development build: babel-plugin-istanbul, nyc instrument or swc-plugin-coverage-instrument for the statement data, plus a development React build that carries source positions (the JSX source transform on React 18, a fetchable source map on React 19). Production twin-server builds do not provide that, so the dockerize skill sets up an opt-in instrumented mode. If either piece is missing, the skill stops and asks rather than estimating around it: a visibility map alone says what is on screen, not which test's code put it there.
The other cost is compute. Shaka-perf is a performance framework, not a replacement for Cypress or Playwright. The cheapest run executes every test at least twice, once per side, and screenshots turn the slightest flakiness into retries. So the target is every important component in a screenshot on the happy path, not every edge case. Line coverage still has a job. It just is not this job.
The same two servers can hunt bugs
Everything above runs on twin servers: one Docker image as two containers, control on the merge base of your branch, experiment on your branch, same seed data. shaka-perf 0.3.1 ships a skill that turns that pair into a QA rig:
/shaka-perf-find-bugs introduced in this branchThe skill reads the diff first and writes down three to five concrete guesses of what could break and the page that would show it. Memoization, cached selectors and context changes tend to break on the second interaction, not the first, so the guesses look like "add an item, then change it, then remove it". Then it drives both servers through the same steps, screenshots each one, and keeps only what misbehaves on experiment and works on control. A guess it cannot reproduce gets three more attempts and is discarded. "No confirmed regressions found" is a legitimate answer, and the control server is what keeps false positives down: expected behavior is not a description the agent wrote, it is a screenshot of the base branch doing the right thing.
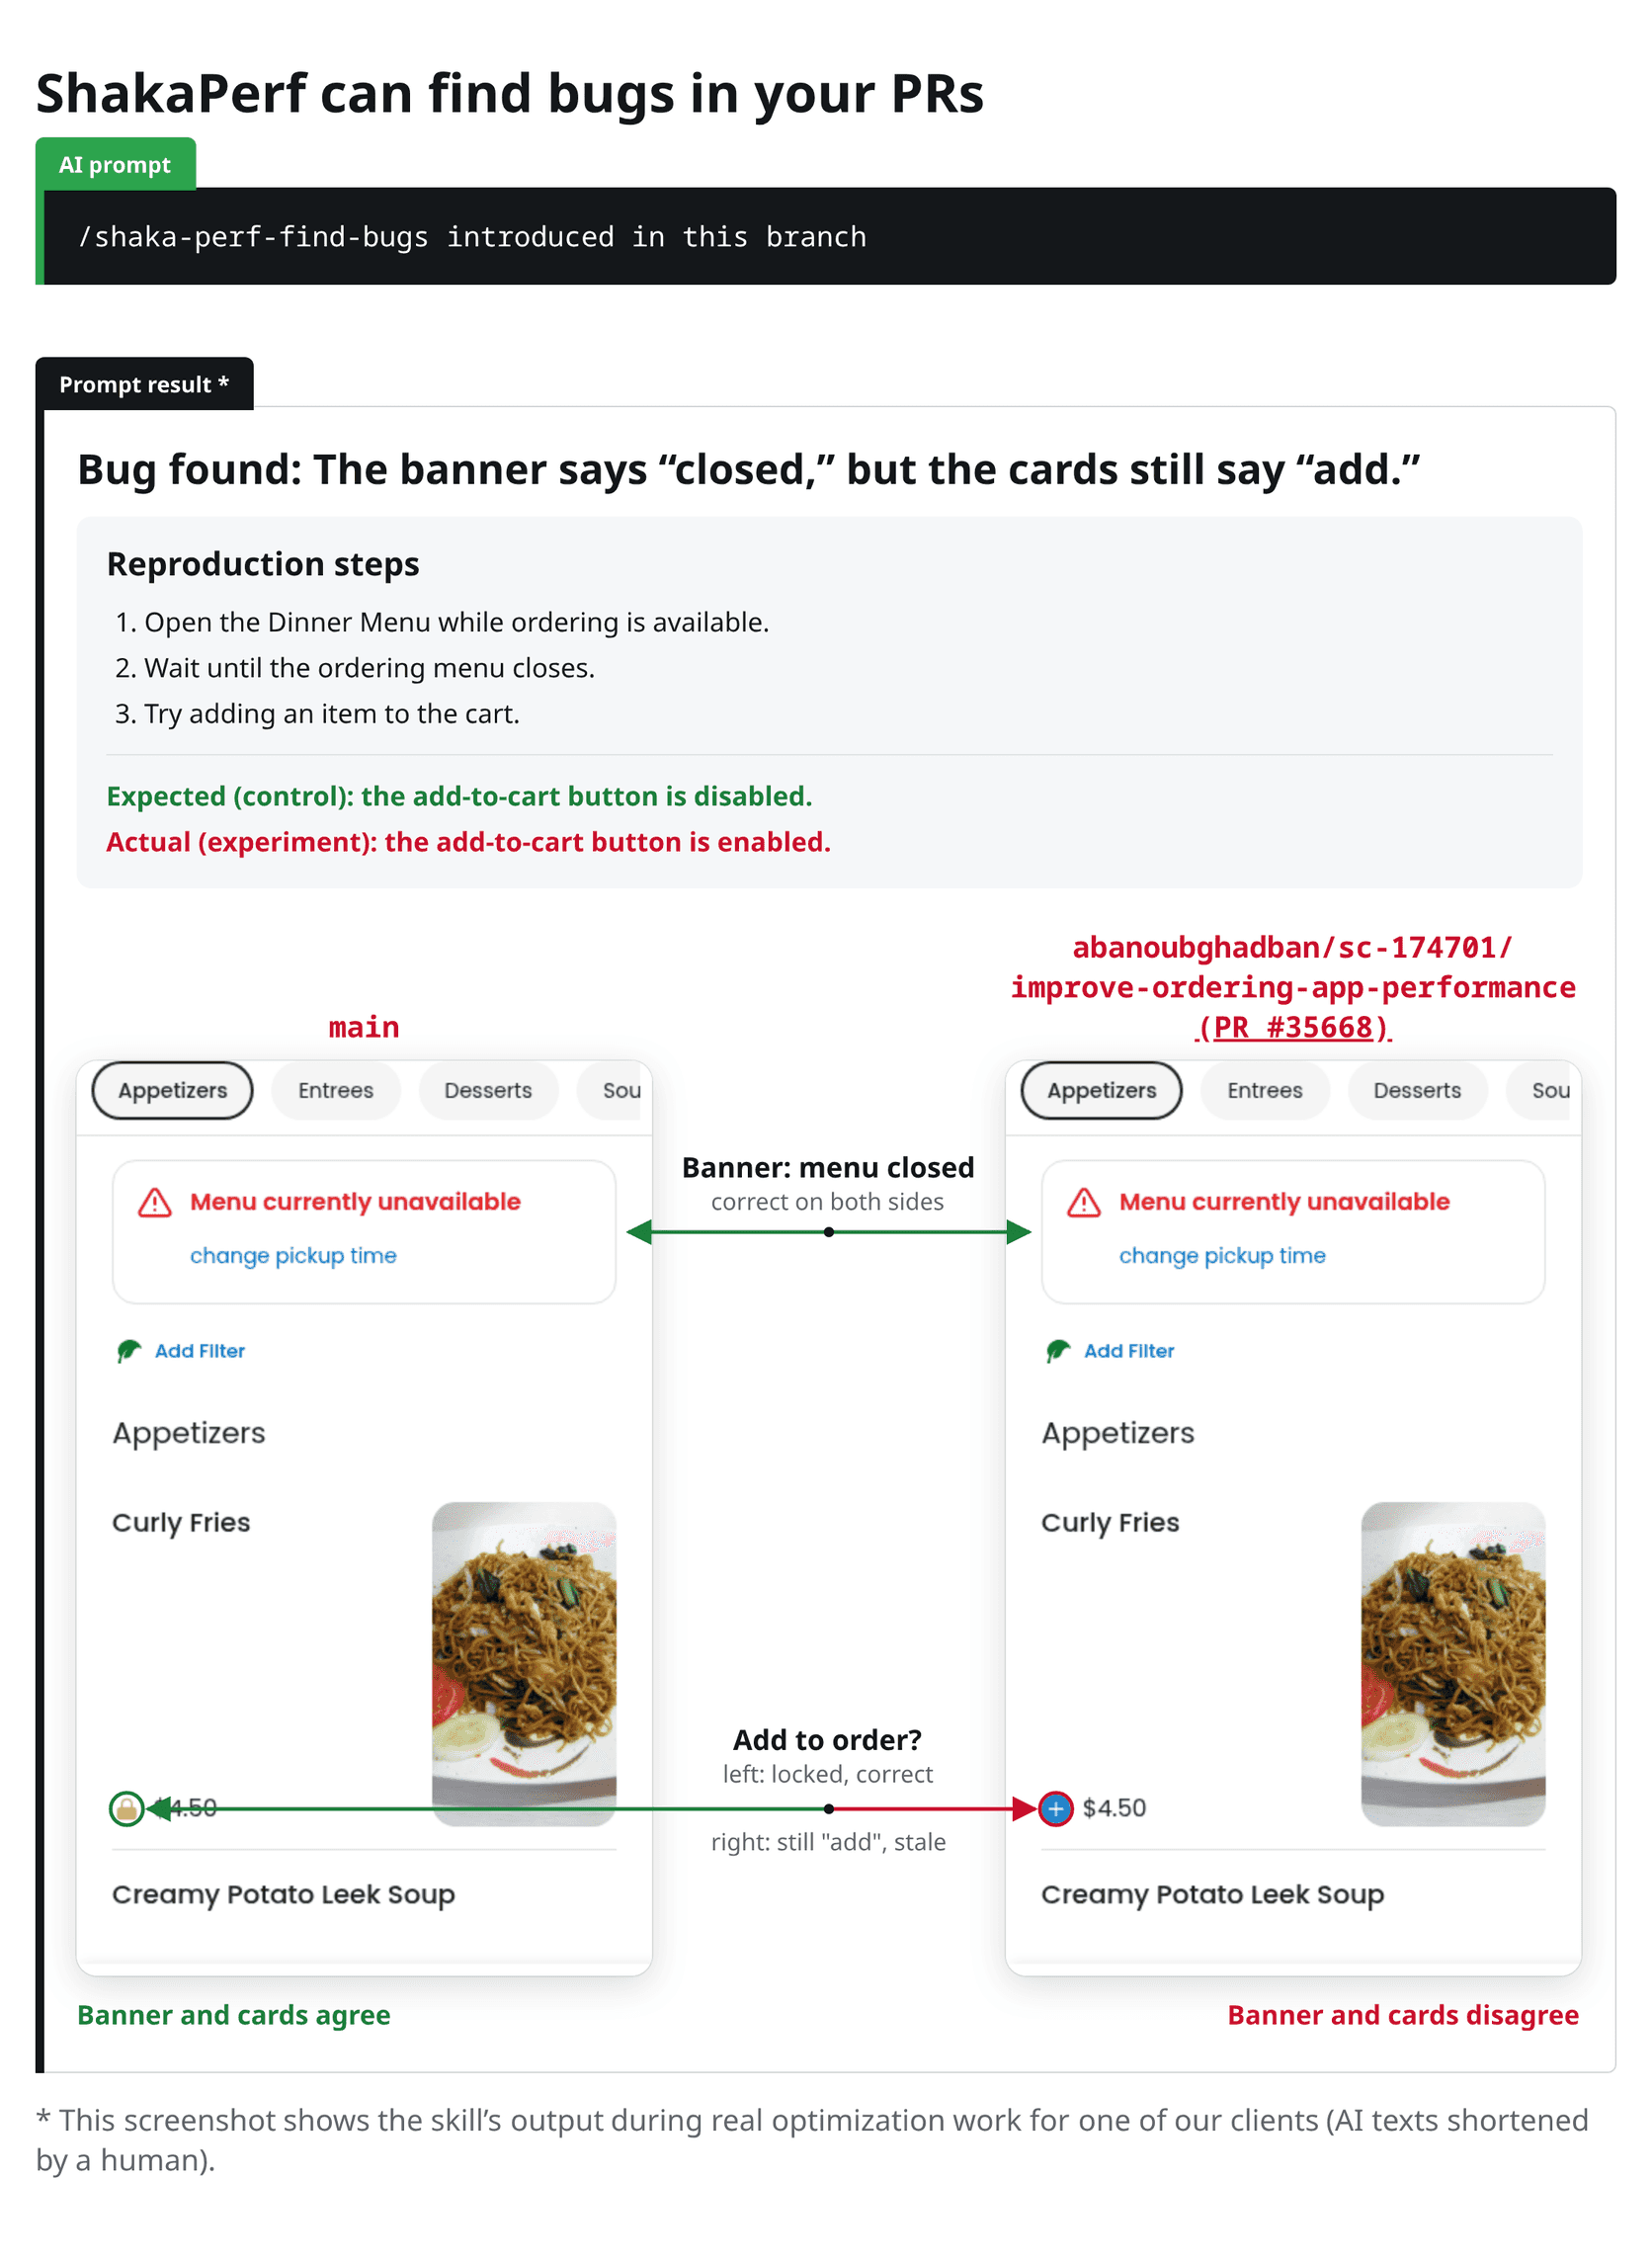
Control on the left, experiment on the right, from a client PR. AI text shortened by a human.
That report came out of real optimization work for one of our clients, an online ordering app. The branch under test was a performance PR. After the ordering window closed, both sides showed the "menu currently unavailable" banner. On main the add-to-cart control was locked. On the branch it still said add. The PR had already been through Cursor's Bugbot, which reviews the diff, and the diff is not where this bug lives. It lives in what the page does after the second interaction, with real data, which two running apps can show and a diff cannot.
ShakaPerf is the toolkit we use in client engagements, where every claim has to survive a production launch. The report is built to be pasted into the PR: a headline with the user-visible symptom, numbered steps, expected versus actual, the paired screenshots, and a copy button for the markdown.
Aloha, Roman
Closing Remark


